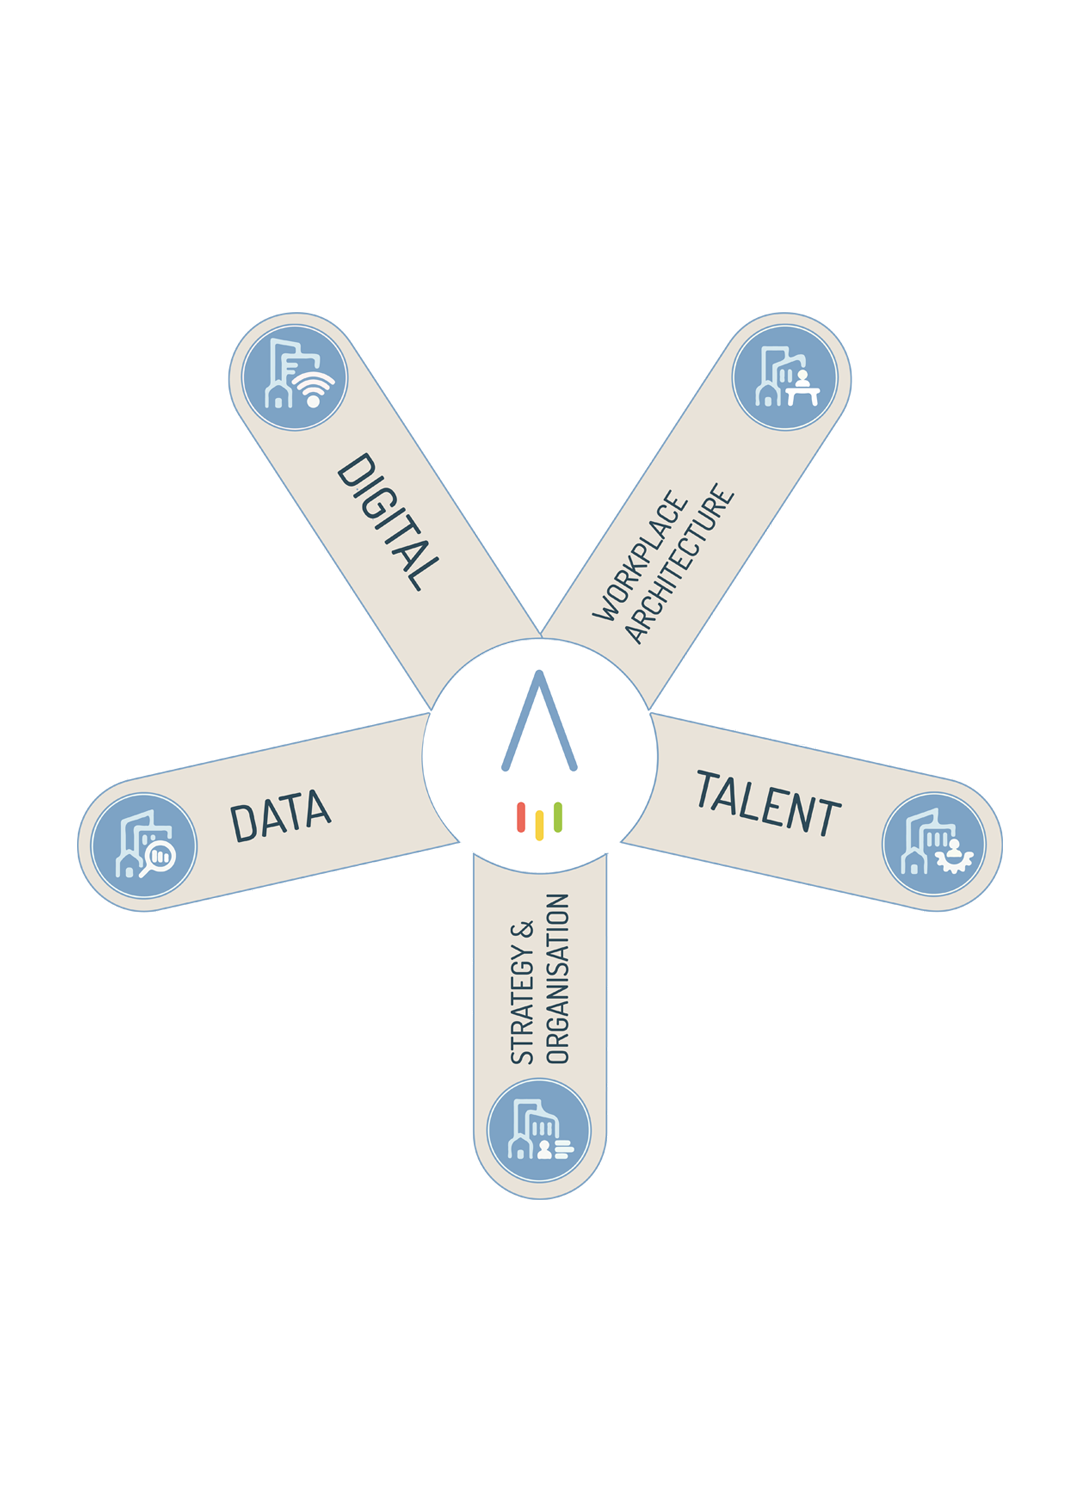


Reduce your costs, improve the ecological footprint of your buildings and optimize the occupancy of your spaces with AREMIS digital solutions, integrating ARCHIBUS and YARDI and other powerful tools.


We have plenty of solutions
Whatever your ambitions, we’ll help you achieve them.
Here's why AREMIS is the solution:
- Expertise: Over 30 years in the industry make the difference
- Integration: Our skills cover all the changing needs of occupiers, workplace revolutions and the latest technological advances
- Independence: Thanks to our independent shareholding, all our recommendations are guided exclusively by your interests.

Partnering with AREMIS means benefitting from our decades of experience supporting organisations of all sizes, and from all sectors in optimising their real estate and workplace management.
Take a look at our long list of case studies.

Why insurance companies trust AREMIS so much
"Thanks to the additional skills of AREMIS experts and their high degree of flexibility, AXA Belgium was able to successfully carry out all the relocation projects...a huge task, very well organised by the AREMIS consultants.
A real success story!"
RAF BOTERDAELE, Head of Building Management AXA Belgium

